Reporting date. This is a rewrite of a TechFlow compilation published on 11 November 2026 at 19:55 (UTC+8). The research it compiles is by Kim Lim and Jasper Jin of Binance Research. Figures below are those in that piece. They are not re-audited here, and the October 2026 events are not current developments.
The split, and whose numbers they are
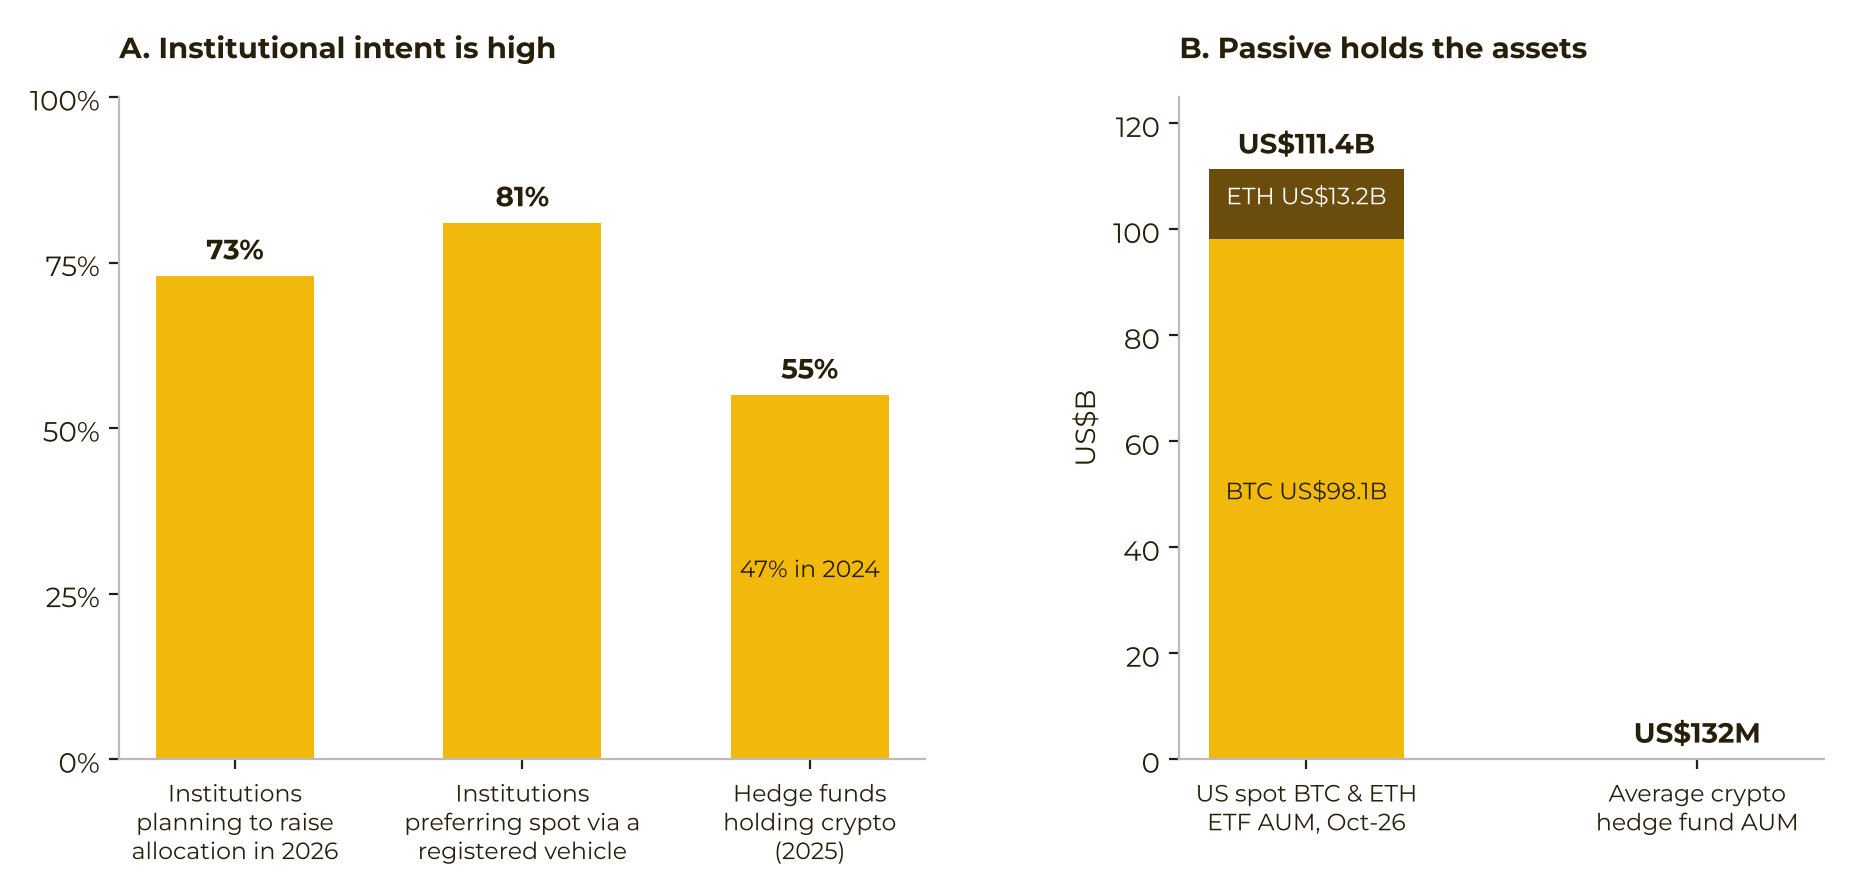
Binance Research, as carried by TechFlow, says US spot Bitcoin and Ethereum ETFs held about $111 billion combined at the end of October 2026. On the same horizon it puts average crypto-hedge-fund assets at $132 million, with 91% of those funds under $1 billion.
The authors’ reading — an interpretation, not an extra measurement — is that the gap is infrastructure, not evidence that managers lack skill. They say the industry built a full institutional path for passive exposure and almost none for finding, checking, and benchmarking active managers. They present Capital Connect, described in the source as Binance’s regulated crypto-fund discovery and allocation platform, as built to fill that blank. That is the sponsor’s account of its own venue. The snapshot is a window on funds that disclose there, not a census of the hedge-fund market.
The update uses a platform cut-off of 31 October 2026 and, for the first time in this series, direct interviews with platform allocators and fund managers. Binance Research said the main conclusions still held in a month it summarized as a 7% Bitcoin decline. The October price figure used with the return comparison is a 7.2% drop.
What the cited surveys actually say
The piece stacks outside surveys against that 31 October 2026 cut-off:
- EY-Parthenon and Coinbase, 2026 joint survey: 73% of institutions planned to raise their digital-asset allocation that year.
- AIMA and PwC: 55% of traditional hedge funds held crypto assets, up from 47% in 2024.
- Among institutions in the surveyed set Binance Research cites, 81% preferred registered, compliant products for spot exposure.
- Among traditional hedge funds that already held crypto, more than half kept the stake under 2% of total assets. Separately, 60% of institutions planned to lift exposure above 2% within a year.
A chart source line also names State Street’s October 2025 digital-asset survey and SoSoValue. The prose does not give State Street its own statistic, so none is added here.
On the product stack the report does describe, the ETF path is custody, audit, a daily net-asset-value mark, and reporting institutions already use. That is a chain of service-provider jobs inside a registered wrapper. It is not the same statement as “coins are visible on-chain.” Assets under management do not identify who has legal title, how liabilities net, or what a shareholder can claim if a service provider fails.
The report infers that small active-fund sizes reflect limits in the investment setup, not a lack of interest. That inference sits on top of the survey answers and the AUM totals. It is not itself a count of refused subscriptions.
Discovery is still personal. The missing checks are operational
Binance Research argues the bottleneck is discovery and verification, not a shortage of managers.
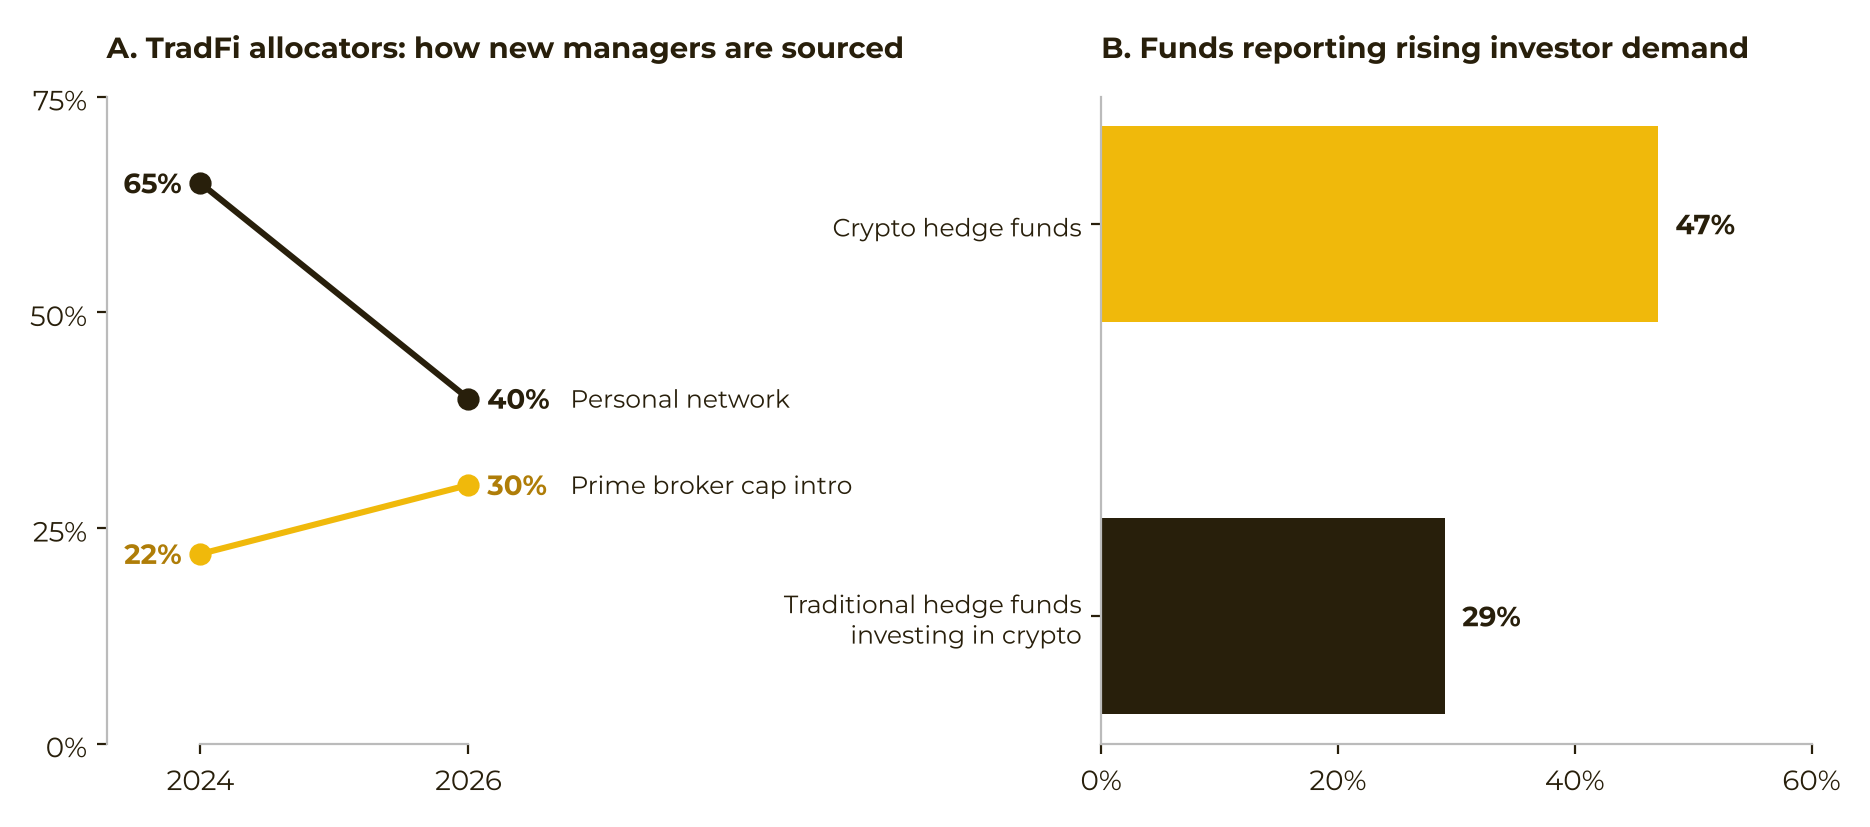
On the traditional side, an AIMA and Marex survey is cited for a change in how capital finds managers: reliance on personal networks fell from 65% in 2024 to 40% in 2026, while prime-broker capital introduction rose from 22% to 30%.
Crypto allocation, in the report’s account, still runs through Telegram groups, conferences, and personal introductions. Without a shared disclosure and benchmark frame, investors cannot compare managers on the same terms. The report says institutions also have trouble verifying what they now treat as required: audited financial statements, custody arrangements, and service-provider qualifications.
The same AIMA and PwC material shows the friction on both sides of the trade. Among crypto hedge funds, 47% said investor demand was rising, against 29% of traditional hedge funds involved in crypto. Family offices and high-net-worth individuals were still the main backers. Only one-fifth of crypto hedge funds listed pensions, endowments, or sovereign wealth funds as a primary investor type, up from one-ninth a year earlier.
A personal introduction does not answer who controls the assets or who owes the investor a process. A wallet view or an exchange balance does not establish legal ownership, a match of reserves to liabilities, an audit opinion, or a customer-protection regime. The report does not claim that it does.
On this platform, fund count and capital point opposite ways
The 31 October 2026 Capital Connect snapshot is the report’s evidence that a disclosure layer makes a preference easier to see. The authors say the layer does not create the preference.
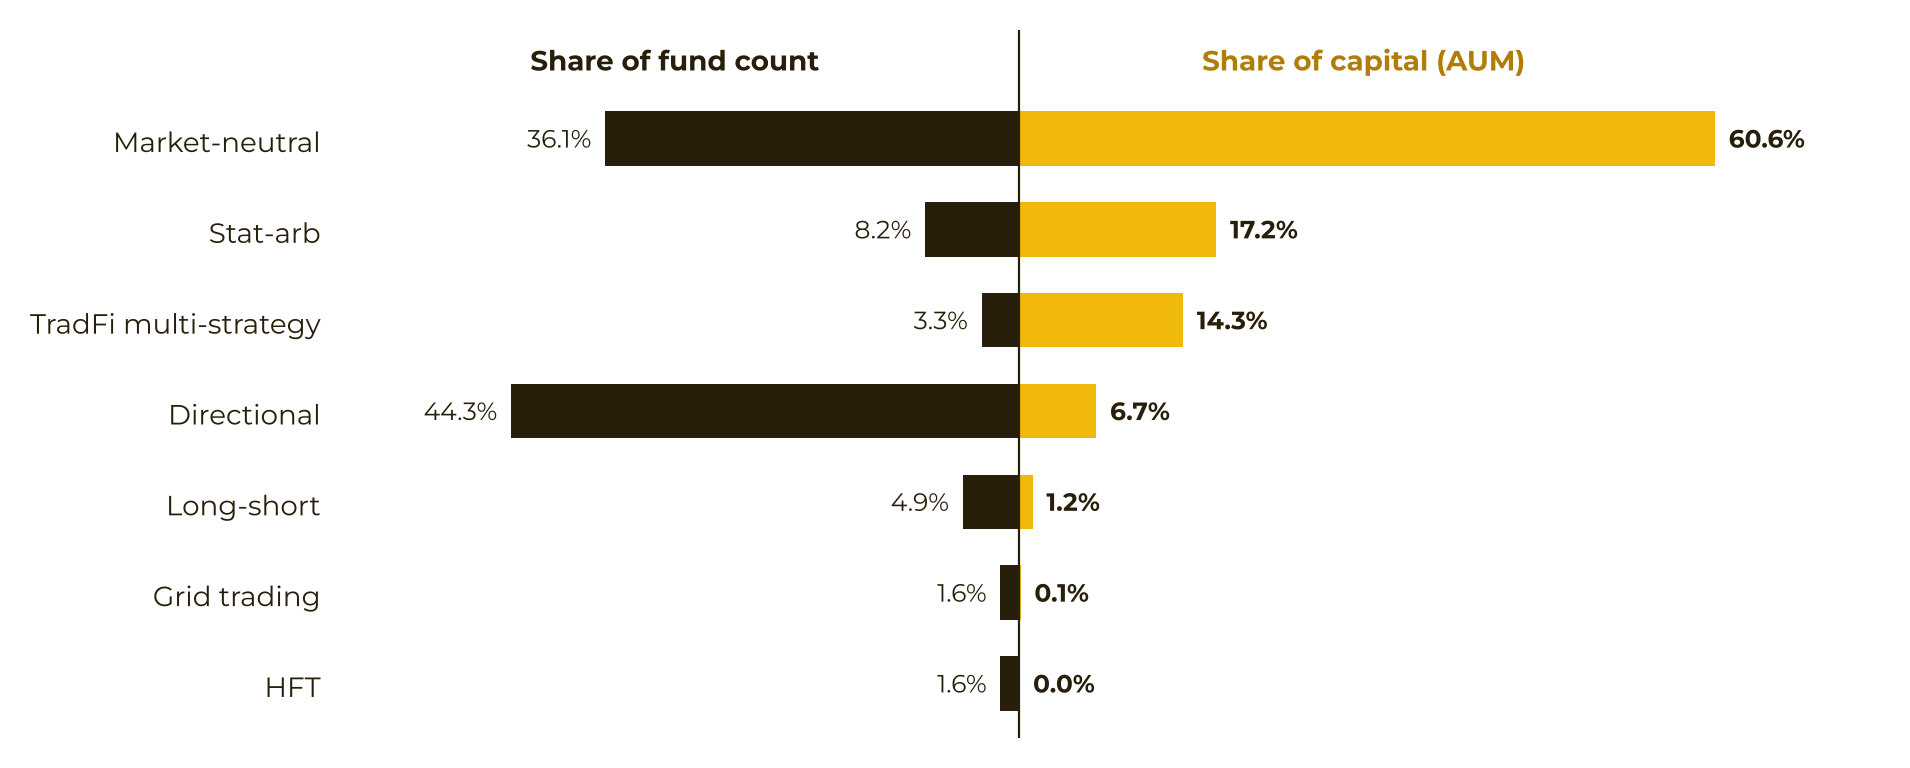
- Directional strategies were 44.3% of funds by number and 6.7% of platform assets.
- Market-neutral, statistical-arbitrage, and traditional-finance-style multi-strategy funds together held 92.1% of platform AUM. The summary line calls this capital-dominant group neutral strategies and says they were under half of funds by count. Multi-strategy alone was 14.3% of AUM.
- The average ticket in neutral strategies was about 11 times the average directional ticket.
Participation into autumn moved the same way. Market-neutral investor participation rose for two consecutive months and was up 30% cumulatively since May. Statistical-arbitrage participation more than doubled over that stretch and stayed stable through October.
The contrast the report draws: many long-tail managers still launch directional products, while capital on this platform concentrates in hedged strategies.
Two mandates, and the October price test
The update says two mandate types were growing together, and that October checked them under stress.
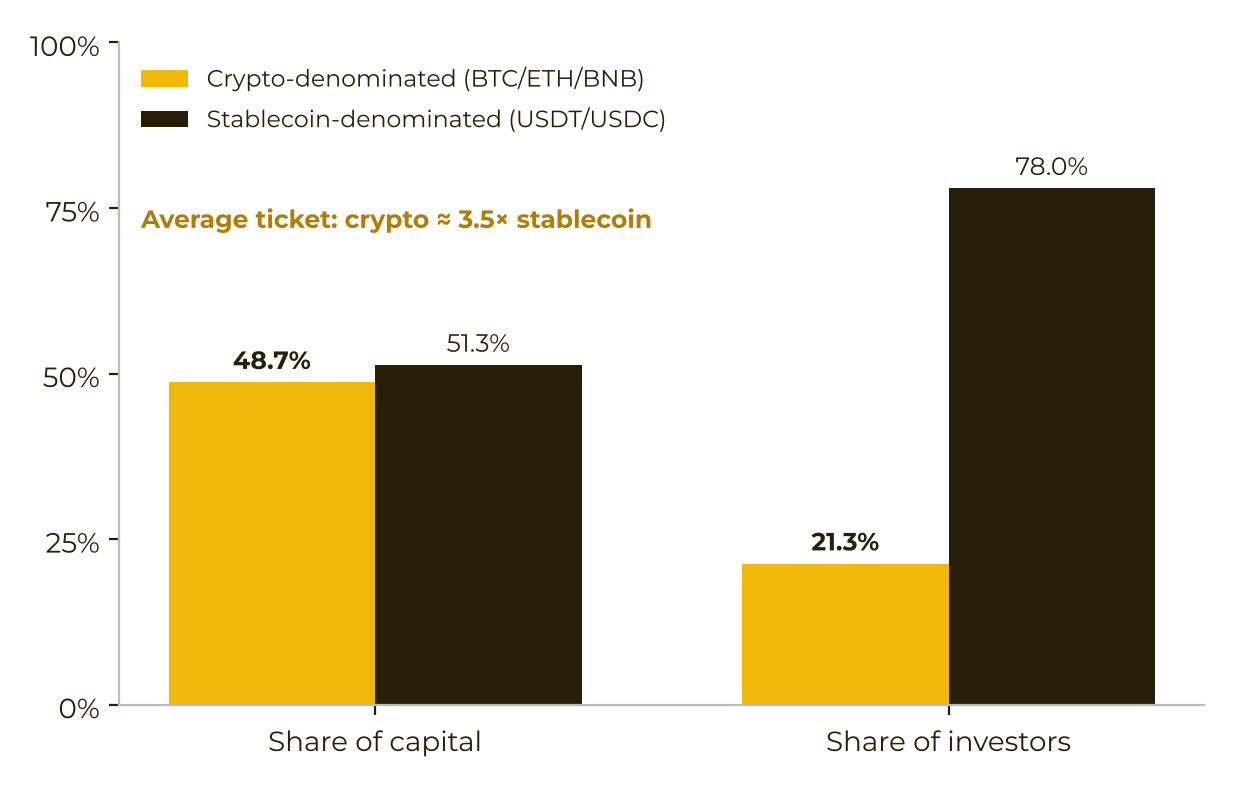
Coin-denominated mandates. Funds denominated in BTC, ETH, or BNB held 48.7% of platform capital, close to half, and about one-fifth of investors. Their average ticket was about 3.5 times that of stablecoin-denominated funds. The bargain described is that the allocator keeps the underlying coin and outsources the hedge. In October, coin-denominated holdings of the coins themselves stayed stable. The pullback in dollar AUM mainly followed the Bitcoin price. A price-linked change in dollar AUM does not show that the manager’s obligation, the custodian, or the hedge changed.
Traditional-finance-style multi-strategy. This was still the third-largest strategy by capital, at 14.3%. Its investor count fell 14% on the month, from 21 people to 18. The report reads that as a maturing market and selective withdrawal, not a reversal, including where strategy results had been steady. That is the authors’ reading. The source does not record why each investor left.
Across both, the update’s summary is that hedge-style strategies still dominated, coin-denominated mandates still produced the largest single tickets, and directional capital was waiting for a clearer recovery signal.
Directional participation came back. The range of results stayed wide
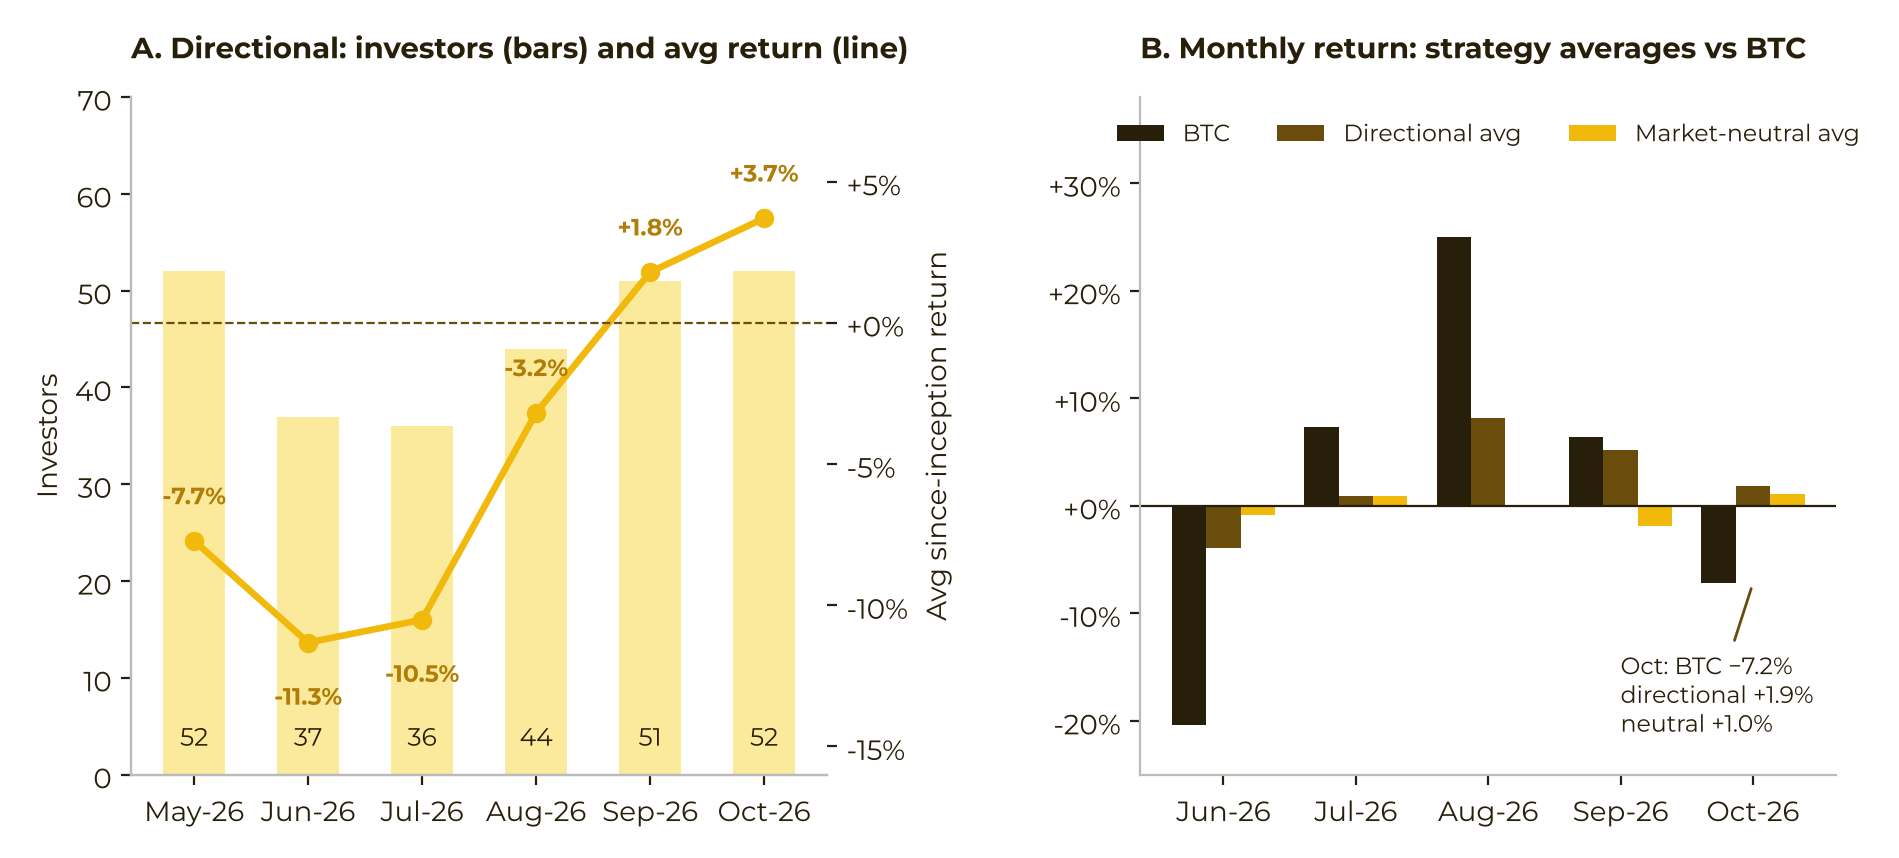
In the Capital Connect sample, directional investor numbers fell sharply after returns bottomed in June, hit 36 in July, and recovered to 52 in October, the May level. The average since-inception result for directional funds improved from −11% in June to +3.7% in October.
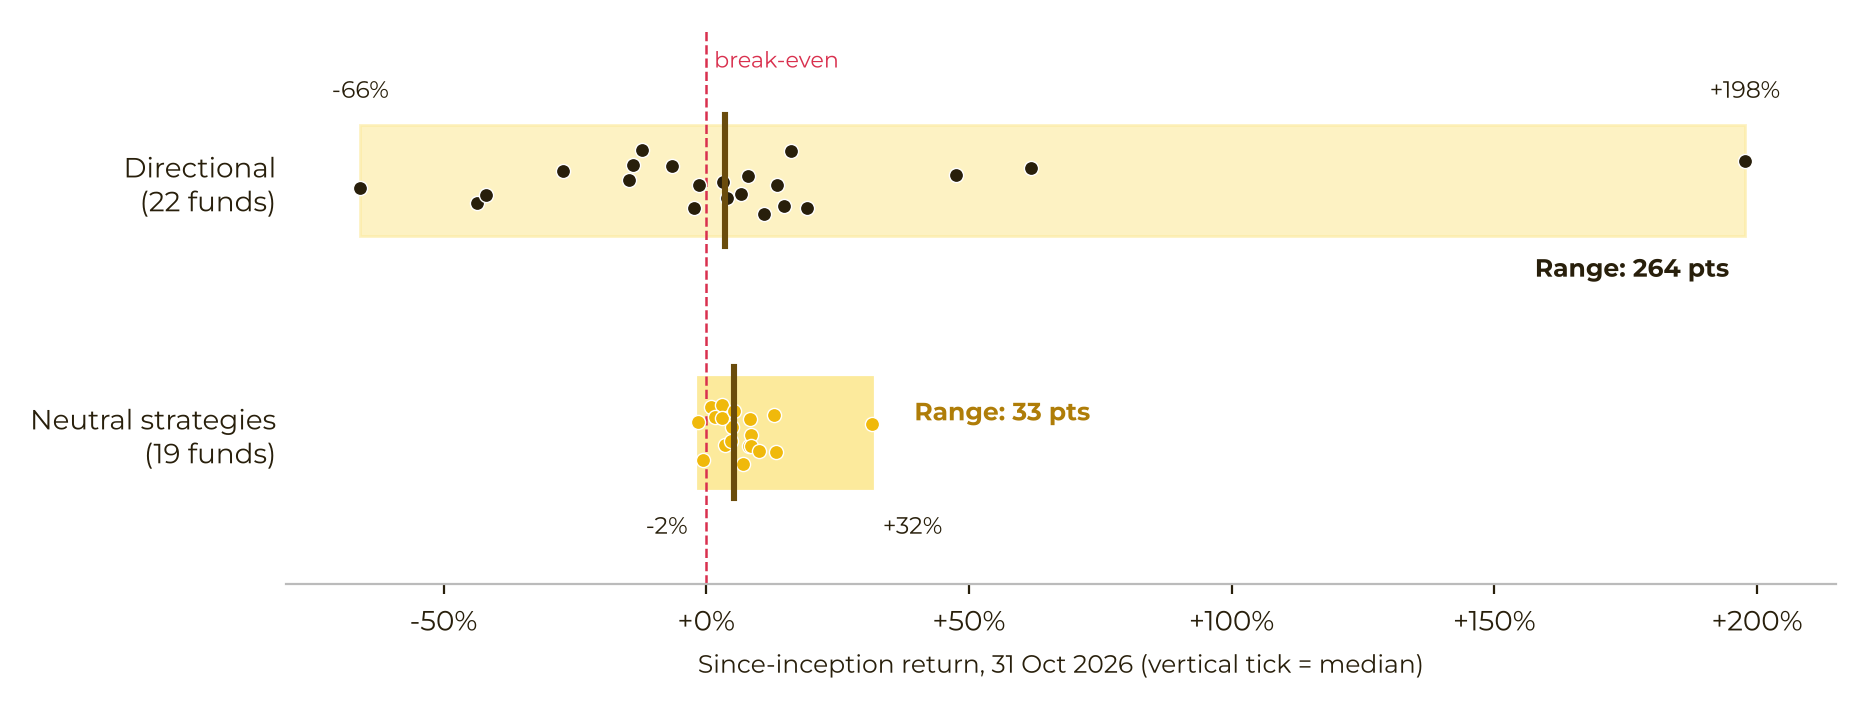
October is described as the first live test of that repair. With Bitcoin down 7.2%, directional funds averaged +1.9% on the month and market-neutral funds averaged +1.0%. The report says these strategy figures are a simple average of fund net asset values. They are not described as asset-weighted. A simple average can be moved by small funds. A dispersion-chart note excludes dormant funds and funds managing under $1,000; its neutral bucket covers market-neutral, statistical arbitrage, and traditional multi-strategy.
Interviews lined up with a stated habit: allocators usually cut directional exposure during drawdowns and add again after volatility and liquidity settle. The piece does not size those cuts.
Dispersion is the other fact on the directional book. The gap between the best and worst directional funds was about eight times the gap for neutral strategies. The directional median was around +4%, and only 55% of directional funds were positive. Nine in ten neutral funds were positive. The top quarter of directional funds averaged +69% since inception. Allocators told the researchers they would still pay for that outcome if drawdowns stayed under control. The report calls that outcome alpha. It does not define it as excess return over a stated benchmark.
Interviews put asset safety ahead of the track record
The interview window is 29 October to 1 November 2026. Respondents were Capital Connect allocators and trading teams running funds on the platform. The source does not give the interview sample size beyond the shares below.
For allocators, asset safety came first. Eighty percent ranked it above historical performance and institutional reputation. Every allocator interviewed said verified internal exchange data would materially strengthen due diligence. They weighted drawdown control over a high mark on paper.
For managers, the fundraising obstacle was the cost of trust, not an unimpressive return. Past results were hard to cross-check. KYC, anti-money-laundering, and counterparty compliance reviews slowed the raise, so most capital still came through people the manager already knew. After listing on the platform, some managers reached a wider investor set, compliant institutions, and pools of small tickets. The source does not say how many managers, how much money, or on what legal terms.
The report’s closing line is that both sides treated verifiability as what opens trust, and operating infrastructure as what widens the channel.
A tighter reading fits the evidence that was actually collected. “Verified exchange internal data” is a due-diligence input these interviewees said they wanted. On the facts given, it is not a liability-matched reserve statement, an auditor’s opinion, proof of legal title, or a customer-protection scheme. Ranking safety first records a preference. It does not show that a safety standard was met, which custodian held the assets, or what that custodian owed the end investor.
What the update does not establish
- It does not assess the solvency of Binance, Capital Connect, or any fund.
- Platform shares are not market shares.
- Simple-average returns are not investor-weighted results, and October 2026 is not a template for the next drawdown.
- A stated plan to raise an allocation is not a funded subscription.
- This desk does not adopt the underlying note’s forward-looking remarks as forecasts.
Binance Research says the report is not a prediction, not investment advice, and not an offer or solicitation to buy or sell any trading product, cryptoasset, or strategy. It says the views were as of the stated publication date and could change; that the information comes from proprietary and other sources it considers reliable; and that completeness and accuracy are not guaranteed. It points readers to Binance’s terms and risk disclosures. This page is a factual brief of the TechFlow compilation, not a recommendation.
Original article: TechFlow, 11 November 2026