This article restates a Binance Research note by Kim Lim and Jasper Jin, carried in Chinese by TechFlow (深潮) and published on ChainCatcher on 11 November 2026 at 22:09 China Standard Time. Figures below are as Binance Research reported them, mainly from a Capital Connect snapshot through 31 October 2026 and allocator and manager interviews held from 29 October to 1 November 2026. They describe that period, not a later market.
Who already had a wrapper, and who did not
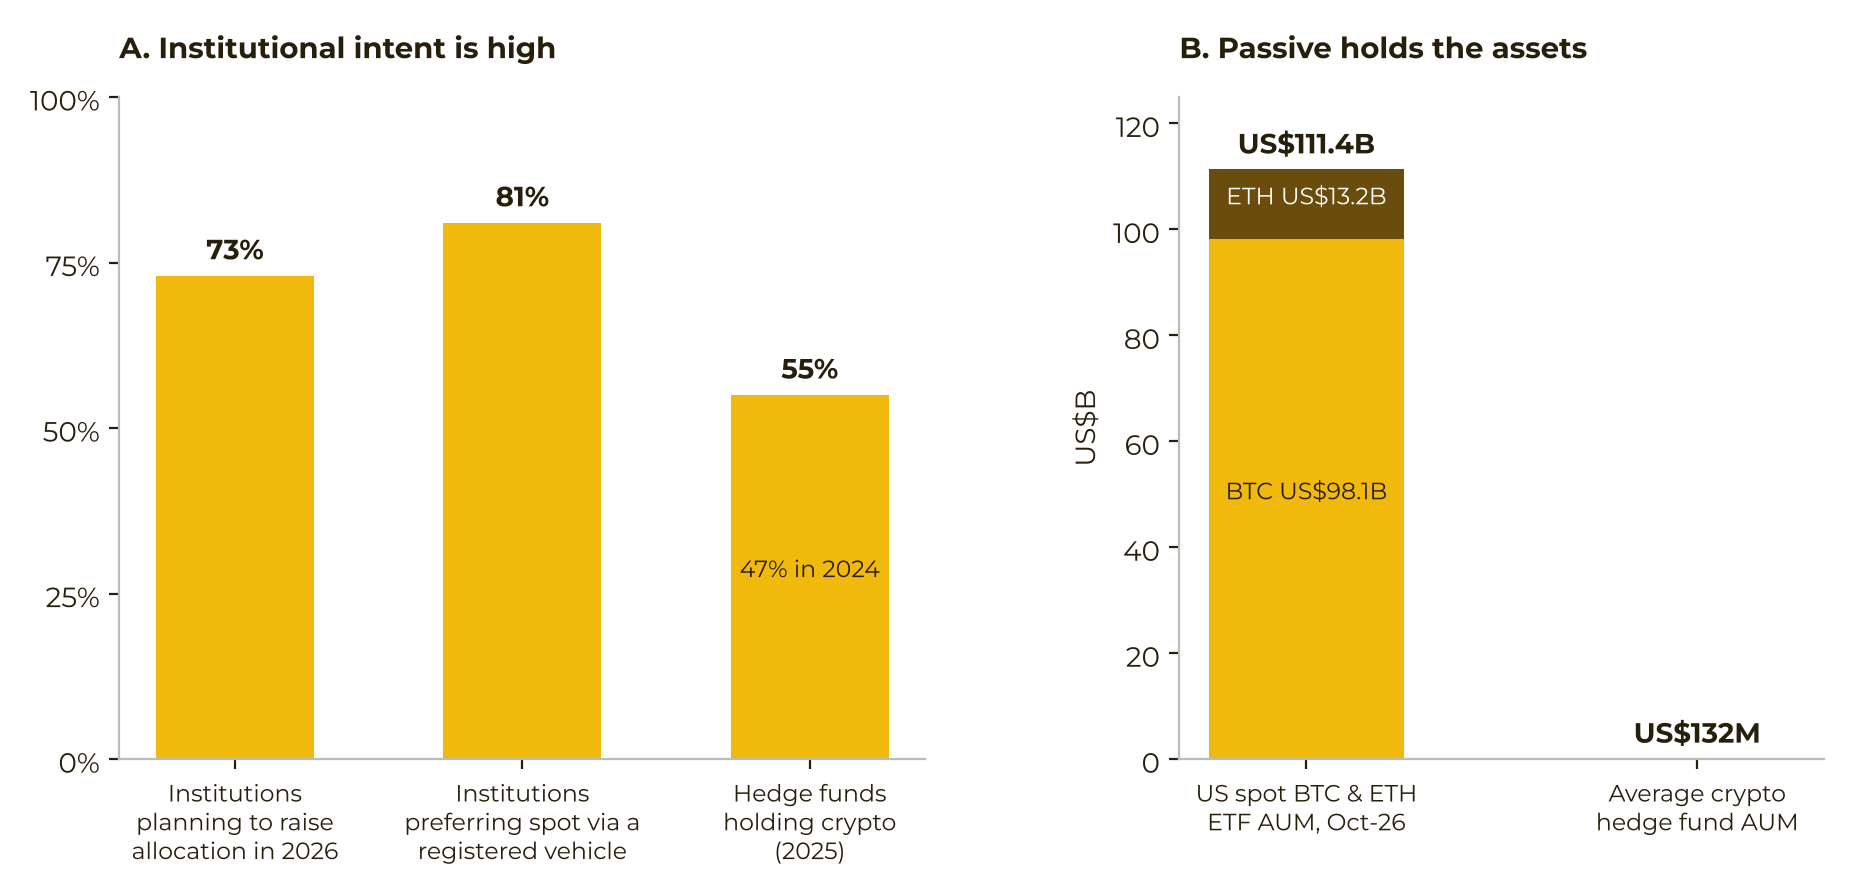
Binance Research’s starting contrast was about vehicles, not about a proven shortage of trading skill. By the end of October 2026, it put combined assets in US spot Bitcoin and Ether ETFs at about $111 billion. Against that, it put the average crypto hedge fund at about $132 million of assets under management, with 91% of those funds under $1 billion.
The report treated the ETF path as an institutional package: custody, audit, a daily net asset value, and reporting formats allocators already use. It argued that active crypto strategies had not offered an equivalent package. That is a claim about distribution and verification infrastructure. It is not evidence that a given manager’s positions, liabilities, or legal title matched any wallet or exchange balance.
Third-party surveys cited in the note pointed the same way, with different samples and dates:
- EY-Parthenon and Coinbase’s 2026 survey: 73% of institutions planned to raise digital-asset allocations that year.
- AIMA and PwC: 55% of traditional hedge funds held crypto assets, up from 47% in 2024.
- Among institutions the report described as surveyed, 81% preferred registered, compliant products for spot exposure.
- Among traditional hedge funds that did hold crypto, more than half kept the allocation under 2% of total assets, while 60% planned to take exposure above 2% within a year.
The note’s reading was that interest was not the binding constraint. A small sleeve and a stated plan to enlarge it do not show who custodies the assets, who owes the investor, or whether reserves cover liabilities.
The layer the report said was missing
Binance Research said institutions had stayed in beta largely because there was no effective way to find, check, and benchmark active managers, and it presented Capital Connect — described in the piece as Binance’s regulated crypto-fund discovery and allocation platform — as built to fill that gap. “Regulated,” in this article, is the report’s description of its own platform, not an independent review of a license, a customer-asset regime, or an audit.
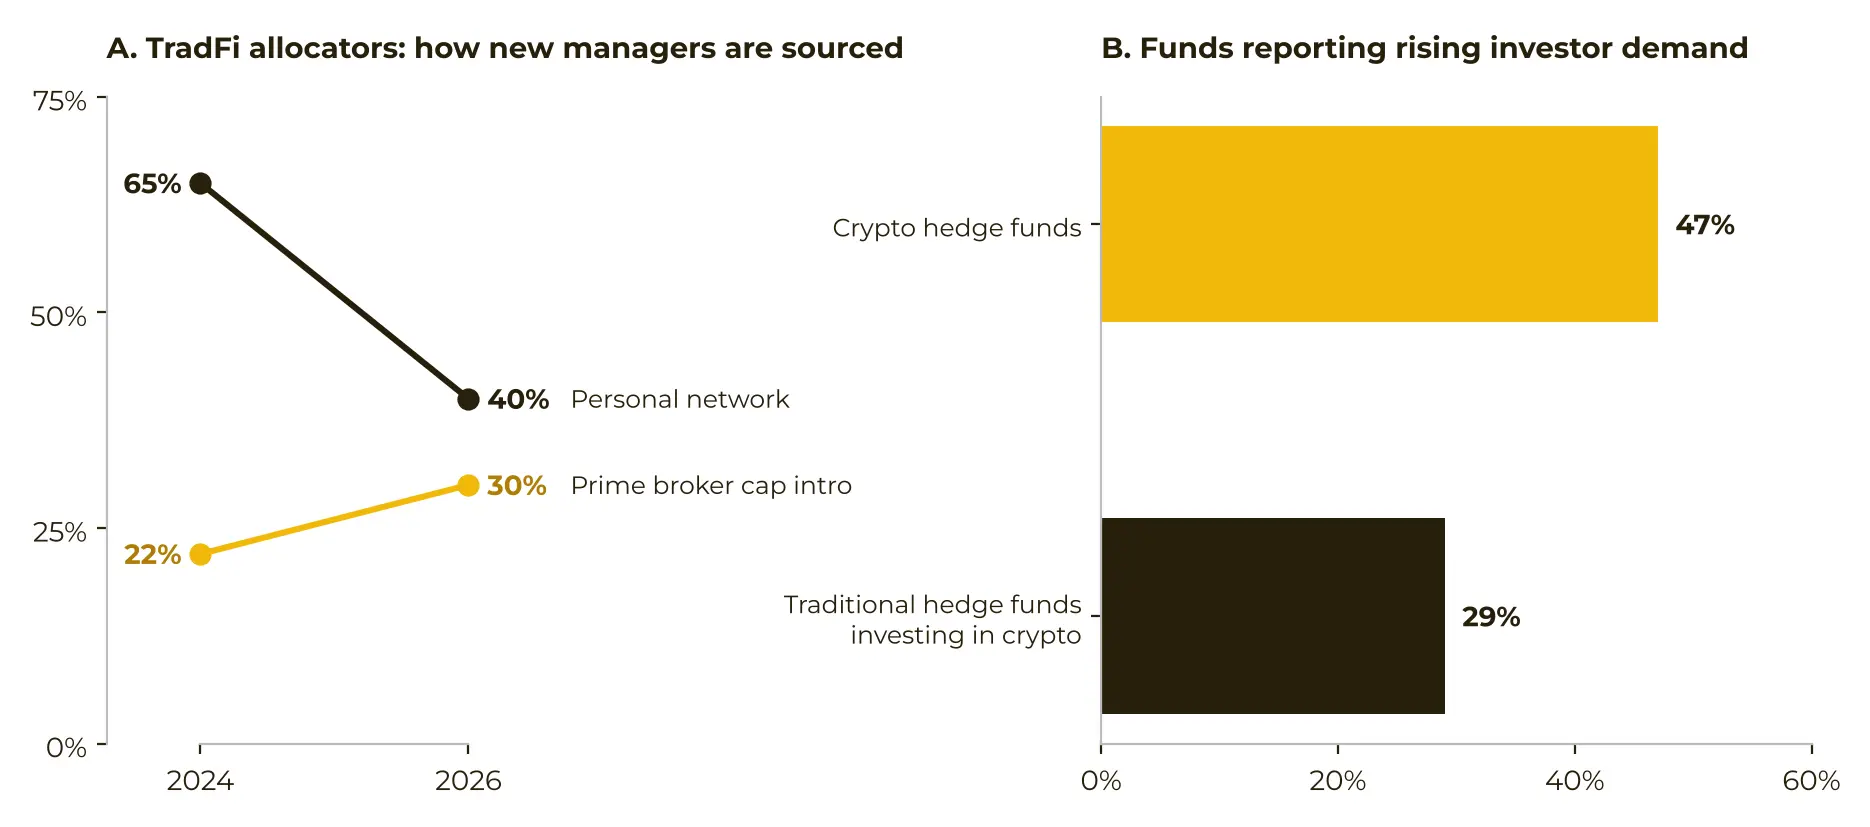
On discovery channels outside crypto, the note cited AIMA and Marex: allocators’ reliance on personal networks fell from 65% in 2024 to 40% in 2026, while introductions through prime brokers rose from 22% to 30%. It said crypto allocation still leaned on Telegram groups, conferences, and personal referrals, without a shared performance-disclosure or benchmark frame, and that institutions struggled to check audited financials, custody arrangements, and service-provider credentials.
Demand, as reported, was uneven. The note said 47% of crypto hedge funds reported rising investor demand, versus 29% among traditional hedge funds involved in crypto. Family offices and high-net-worth individuals remained the main backers. Only one-fifth of crypto hedge funds listed pensions, endowments, or sovereign wealth funds as a primary investor type, up from one-ninth a year earlier.
What the platform snapshot showed, and what it cannot show
Capital Connect is a window onto funds that disclose on that platform and are measured to its standard. It is not a census of crypto hedge funds. Binance Research said the October pattern matched earlier months.
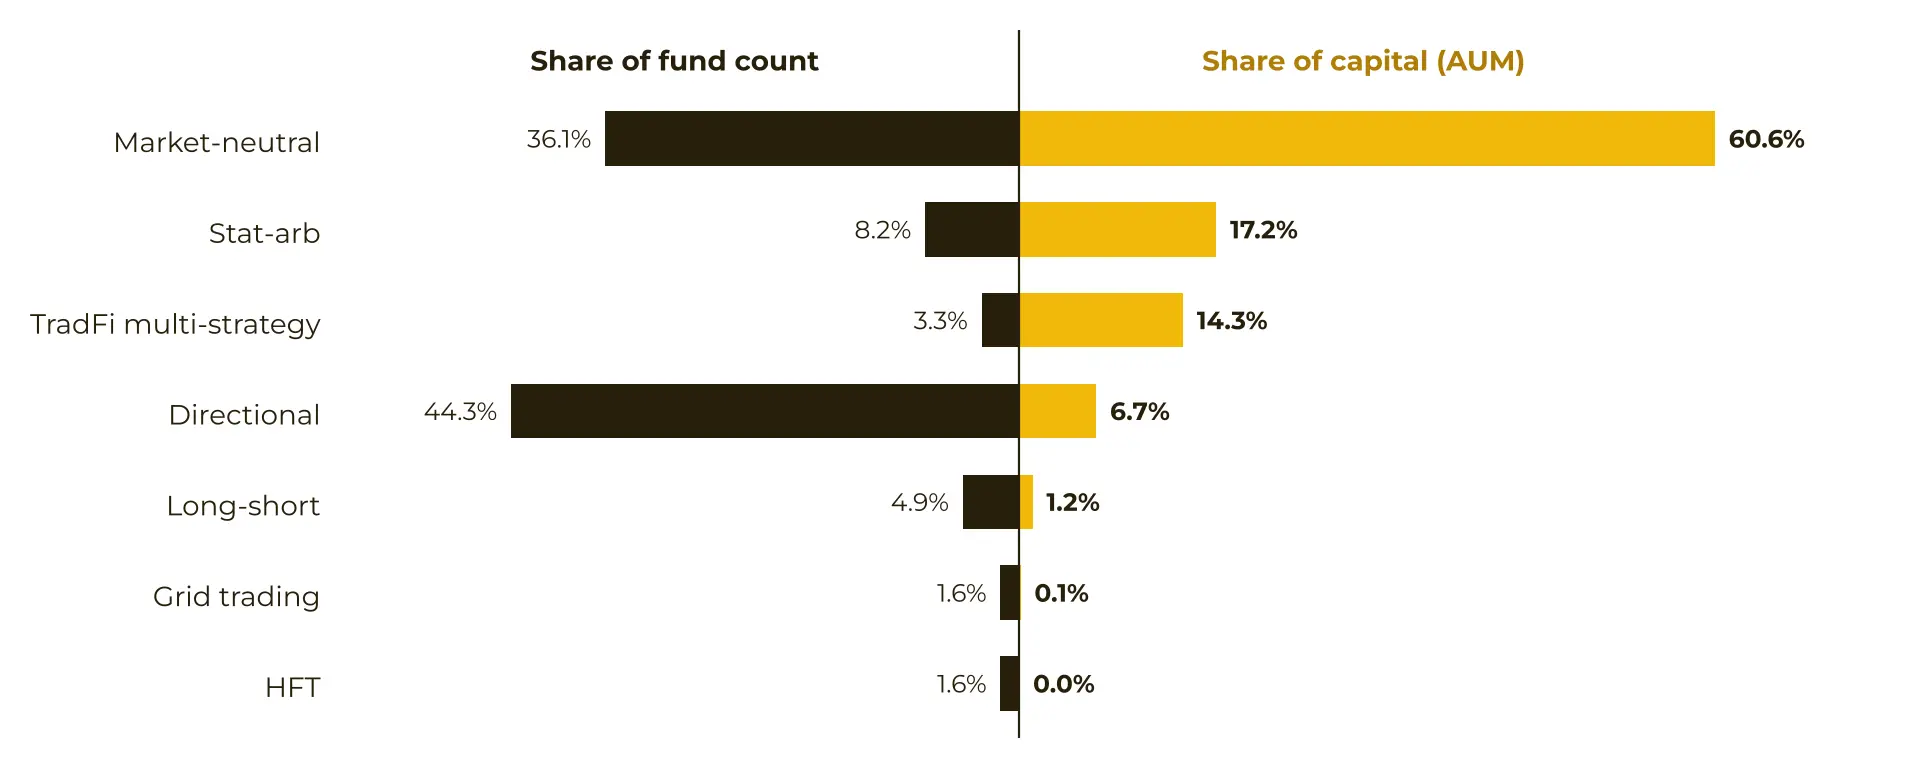
Directional strategies were the largest group by count, at 44.3% of funds, but only 6.7% of platform assets. Market-neutral, statistical-arbitrage, and traditional-finance-style multi-strategy funds together held 92.1% of assets under management; multi-strategy alone was 14.3%. The summary also said neutral-strategy funds were under half of the fund count while taking 92.1% of platform capital. Average ticket size for neutral strategies was about 11 times that for directional strategies.
Participation moved with that split. Market-neutral investor participation had risen for two straight months and was up 30% since May. Statistical-arbitrage participation had more than doubled over the same span and stayed steady through October. The report’s point was that a long tail of managers still offered directional products while platform capital sat in hedged strategies. A discovery layer can make a preference visible. It does not create the preference, and it does not prove the preference is justified.
Two mandate styles under an October drawdown
The note described two growing mandate types and used October 2026 as a stress check.
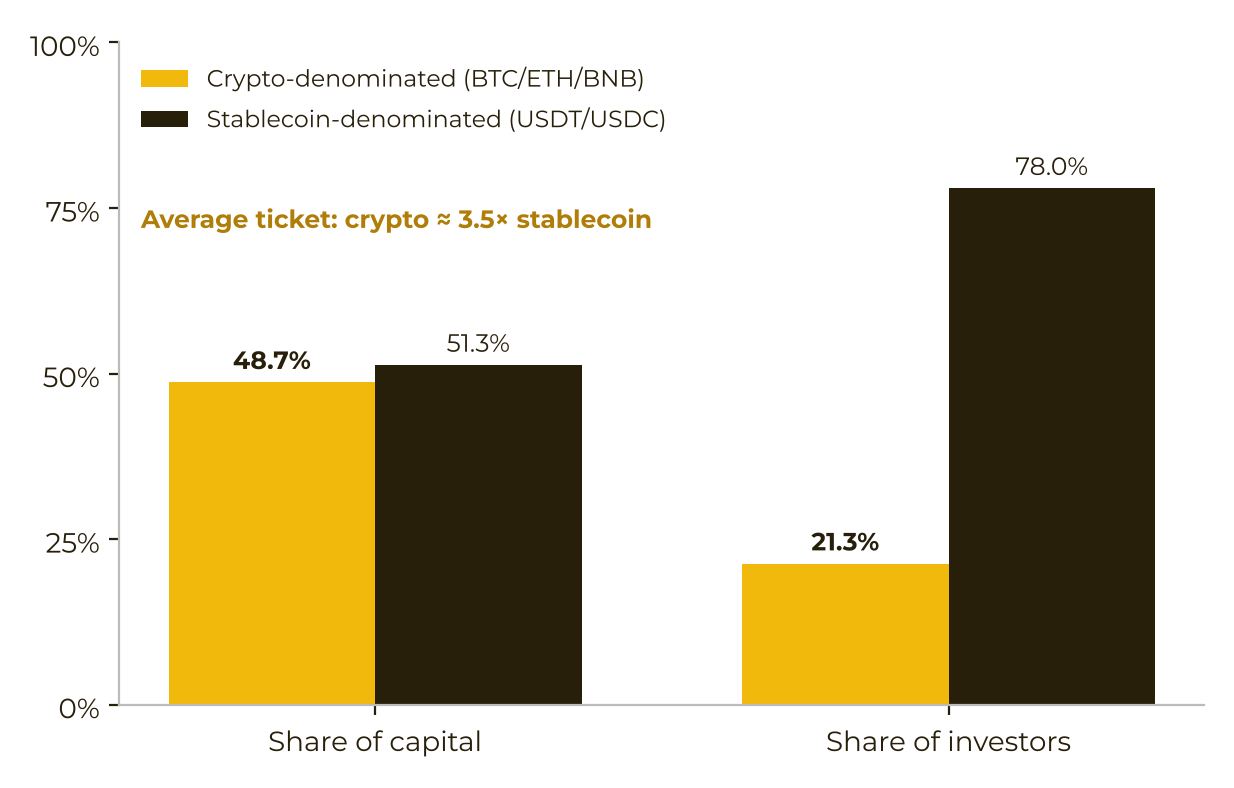
Crypto-native mandates: nearly half of platform capital, 48.7%, sat in funds denominated in BTC, ETH, or BNB. Those funds accounted for about one-fifth of investors, with an average ticket about 3.5 times that of stablecoin-denominated funds. Allocators kept exposure to the underlying coin and outsourced the hedge. The report said coin-denominated physical holdings stayed stable in October, while the dollar value of assets moved mainly with the bitcoin price. A stable coin balance is not the same thing as a legal claim, a liability match, or a statement that a custodian cannot fail.
Convergent mandates: traditional-finance-style multi-strategy funds were still the third-largest strategy by assets, at 14.3%. Investor count in that strategy fell 14% from September, from 21 to 18. Binance Research read that as caution inside a maturing market, not as a reversal: familiar product structure drew institutions in, and some still stepped back even when the strategy’s reported results were steady.
Directional money returned, with a wide gap between funds
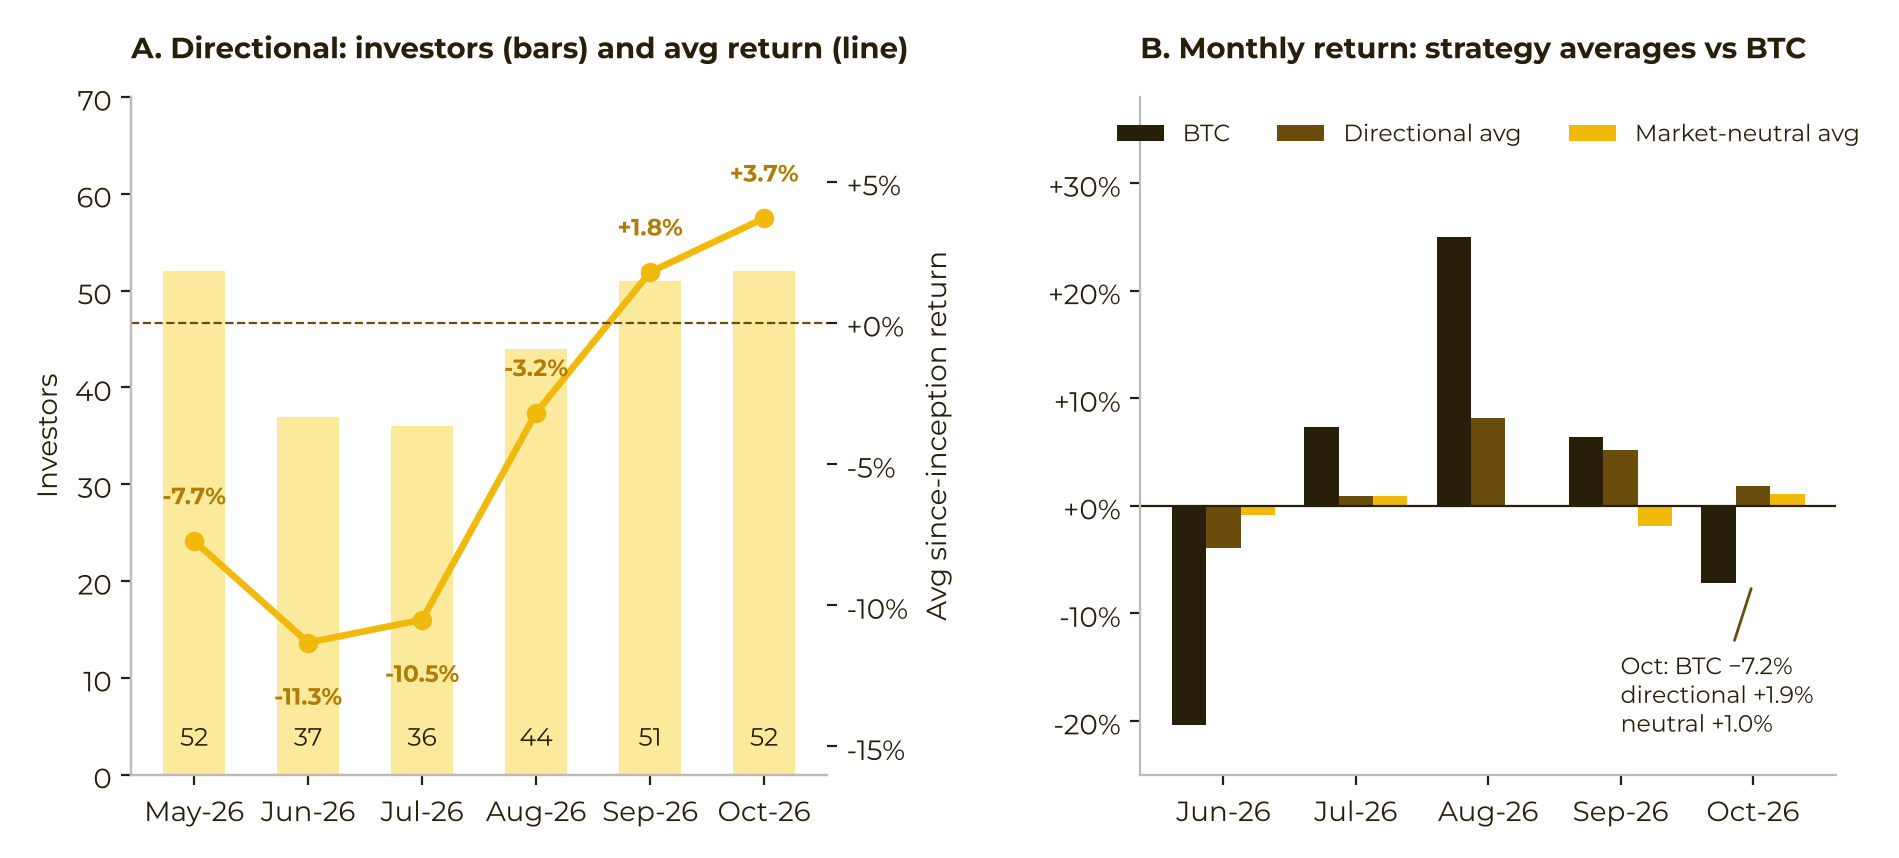
Directional participation repaired after a mid-year trough. Investor count in the sample fell to 36 in July, then recovered to 52 in October, back to the May level. Average since-inception return for directional funds improved from −11% in June to +3.7% in October. Those are simple averages of fund net asset values on the platform, as the chart notes describe them, not a single investable index.
October was the first live test of that repair in the report’s telling. Bitcoin fell 7.2% (Binance BTC/USDT in the source note). Directional funds still averaged +1.9% for the month; market-neutral funds averaged +1.0%. Interviewees described a habit of cutting directional exposure in drawdowns and adding again after volatility and liquidity settled. Behavior in one month is not a control limit.
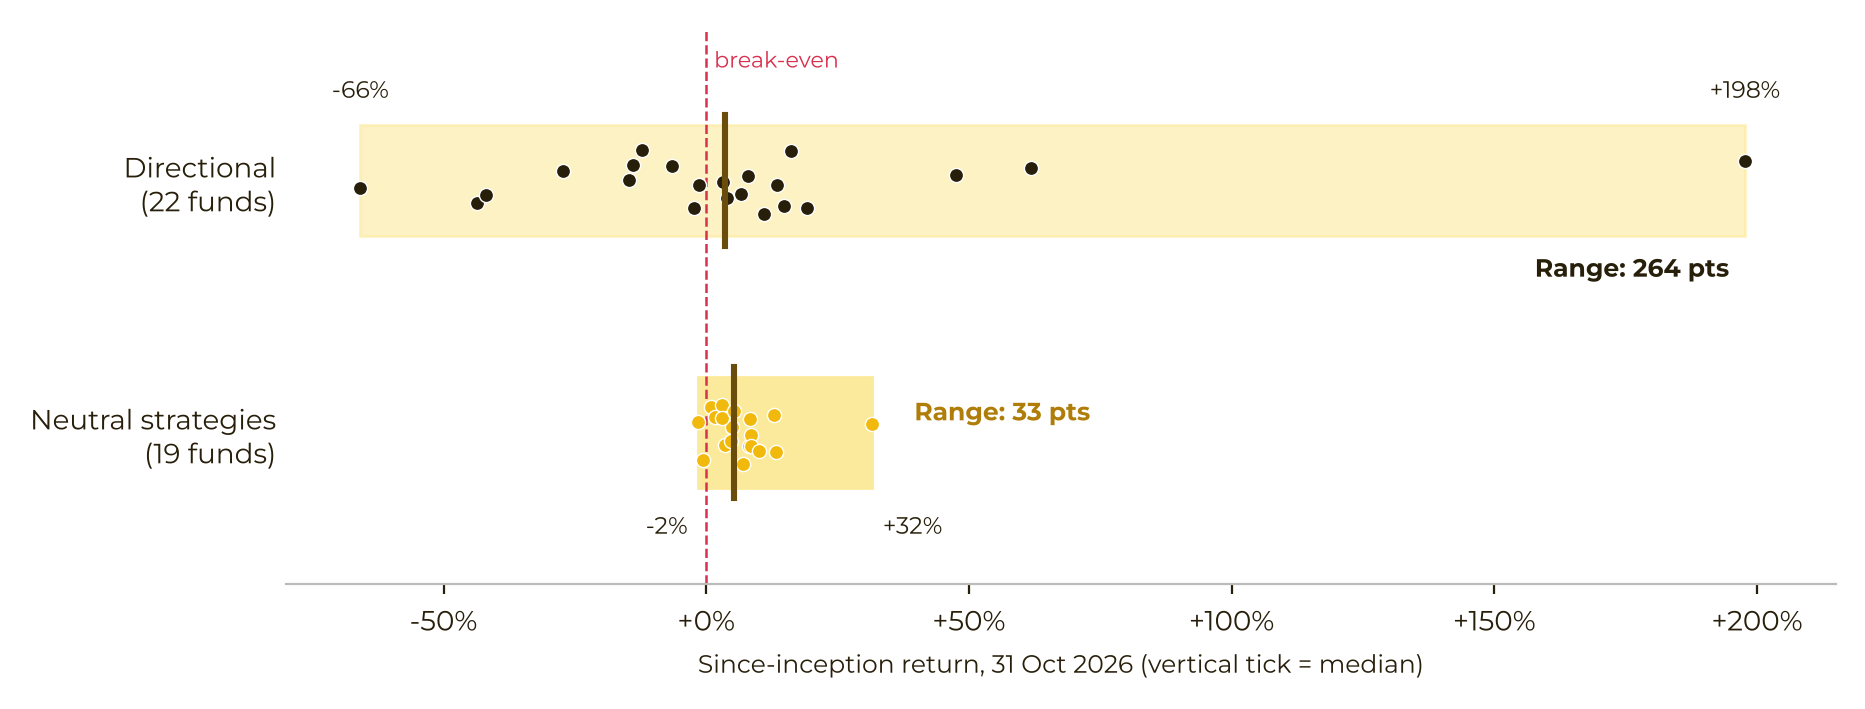
Dispersion stayed large. The gap between the best and worst directional funds was about eight times the gap among neutral strategies. The directional median was around +4%, and only 55% of directional funds were positive. Nine in ten neutral funds were positive. The top quarter of directional funds averaged +69% since inception. Allocators told the researchers they would still pay for that kind of result if drawdowns stayed controllable. A top-quartile average is not a promise that the next dollar can buy the same stream, and it says nothing about fees, gates, or who is on the hook if the manager or a venue fails.
What allocators said they needed before they would scale
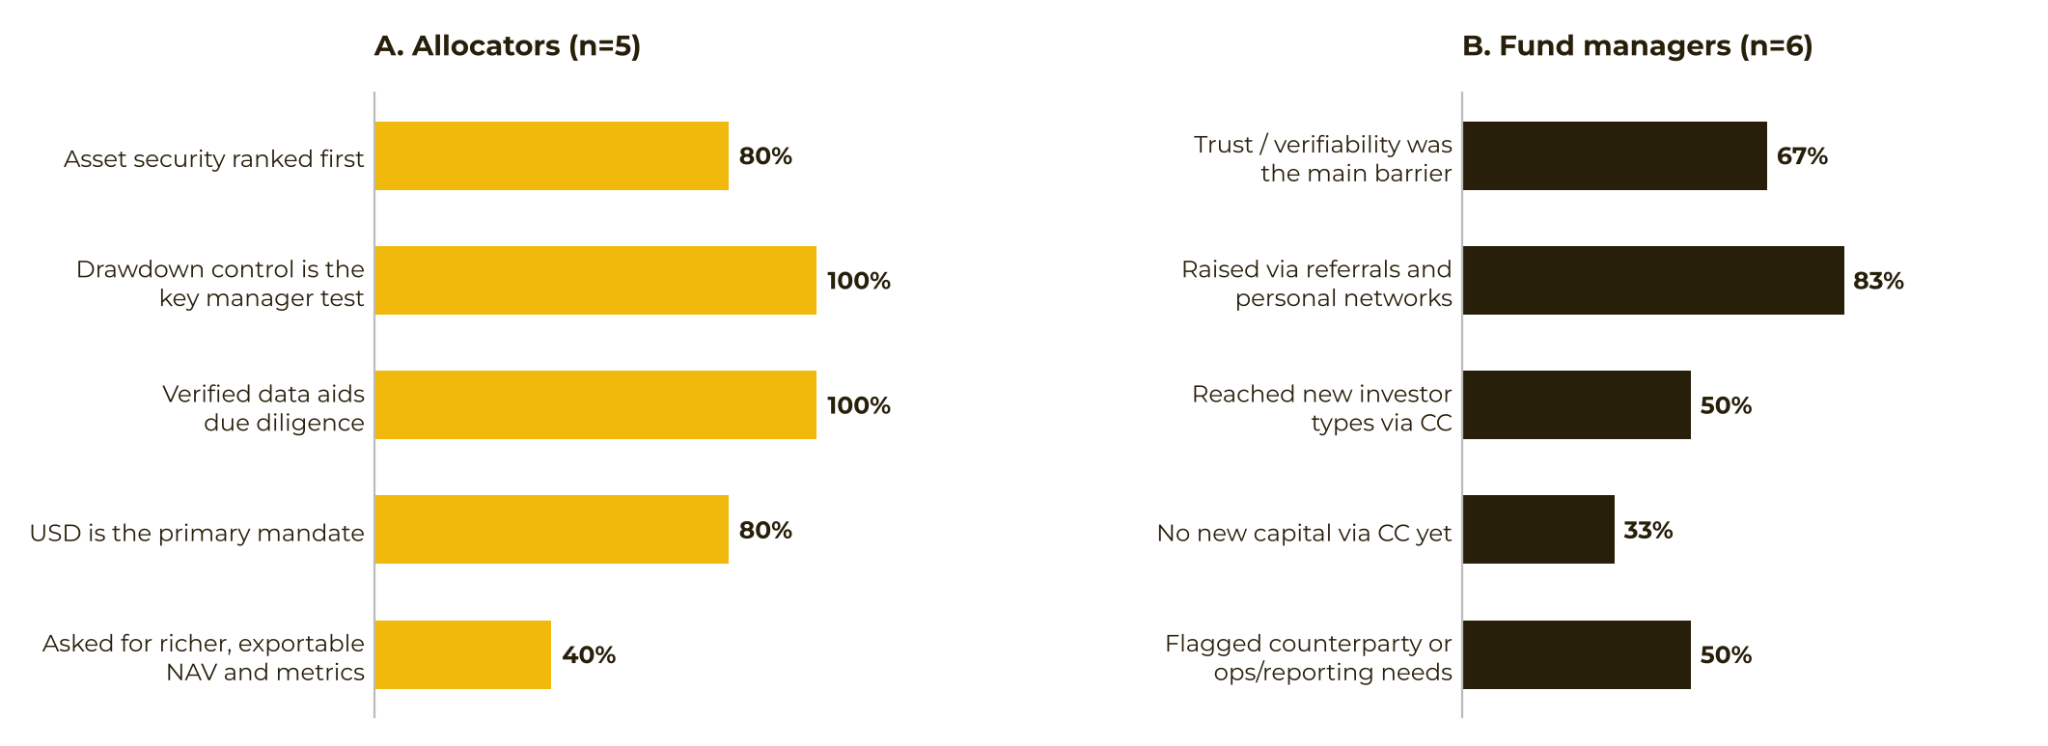
Binance Research interviewed allocators and trading teams on Capital Connect. It reported a consistent answer: verifiability, not the return print, was what moved an allocation.
For allocators, asset safety ranked first. Eighty percent put it above track record and institutional reputation. Every allocator interviewed said verified internal exchange data would materially strengthen due diligence. They also said they weighed drawdown control more than a high mark-to-market gain.
The report does not define that “verified” data: which venue, which fields, which period, who attested, or whether the check covers liabilities, rehypothecation, or legal ownership. Exchange-reported or on-chain balances can show that coins sat somewhere. They do not, by themselves, establish an audit, solvency, customer protections, or that an investor is a creditor of a particular entity.
For managers, the stated fundraising obstacle was trust cost rather than a dull return. Track records were hard to cross-check. KYC, anti-money-laundering review, and counterparty compliance slowed closes, so most capital still arrived through personal introductions. After listing on the platform, the note said, some managers reached a wider set of investors, compliant institutions, and pools of smaller tickets. That is a distribution claim about this platform. It is not a finding that listing equals custody safety.
What this record does not establish
The scale gap between spot ETFs and active funds is a reported fact pattern inside the sources Binance Research used. It does not rank managers, and it does not show that neutral strategies are safer in law or in a stress that differs from October 2026. Platform shares of assets are shares of Capital Connect capital, not of the hedge-fund industry. Positive months during a 7.2% bitcoin decline do not measure tail risk, leverage, or counterparty exposure. A preference for safety and verified venue data does not specify the obligation chain: who holds the coins, in whose name, against which liabilities, and what an investor can claim if the exchange, the administrator, or the manager stops performing.
Binance Research said the report is not a forecast, an offer, or a recommendation to buy or sell any product, token, or strategy, and that its views were current only as of the stated publication date.
Original article: ChainCatcher, 11 November 2026.